Clash Detective Reports: Automate Your BIM Clash Checks
Jan 26, 2024
Hello everyone!
I hope you had a wonderful New Year’s celebration and are energized for new achievements this year! Before getting down to business, I want to wish everyone a happy new year — may it bring success in your work and joy every day.
Usually, I don’t publish original articles on my news channel, but I feel that occasionally, it might be refreshing to intersperse BIM world news with opinion columns. If you like this idea, please let me know. Previously, I used to publish articles here. I will continue to post my articles on Medium as before.
Now, onto something interesting. I want to share a project I’ve worked on over the past month. It’s been a hobby alongside my main job, but the outcome is noteworthy.
If you recall, I previously showed you how to use CSS and JS to enhance the readability of reports from Autodesk Revit. In this article, it’s time to turn our attention to Navisworks reports.
Report Generation
If you’re working with Navisworks, you’ve likely encountered its collision reports (clash detective) — not the most user-friendly reports out there. They’re understandable, but not user-friendly!
You know what always bothered me? The a need to maintain a separate table for collision statistics. And where you might ask? In Excel, of course! It doesn’t take a genius to see how inconvenient this is.
As you can see from this simple diagram, it’s at the stage of entering data into Excel that the “human factor” comes into play, which can later backfire on us. It seems I forgot to show you the report itself and how it looks. Let me rectify that; here are the reports I attach to emails after each model check:
As evident from the table above, filling in each cell required manual work, which was extremely time-consuming. At the end of the year, having found some free time, I decided to make my work more efficient and automate this process.
Preparing Collision Data
As soon as I receive reports from Navisworks in HTML format, the question arises: how can I make them more convenient for further use without having to write a lot of code? After all, the reports must remain accessible to my contractors without extra hassle. So, the task was simple: use HTML reports as a data source.
Let’s look at an example of the structure of folders and their contents:
I must mention, I deliberately chose not to use any plugins or add-ons for Navisworks. The reason is simple: the solution should be as straightforward and scalable as possible.
I settled on Power BI. It’s essentially the same as Excel, but more adapted for graphical reports.
One of the convenient features of Power BI is its similarity to Excel. If you, like me, have previously used Excel, you will find Power BI easy to learn. Moreover, Power BI is compatible with many extensions, making it a versatile tool. I even discussed how Speckle can be used in combination with BIM data in one of my articles. If you’re interested in this topic, you can check it out here and here.
By the way, for clarity, I found a comparative table that might be useful for you in the future.
Since all my HTML reports are stored in one folder, I can easily pull them from there without worrying about updating paths. Another significant advantage is that I save the reports using their creation dates in the names. This allows us to use these names as the creation dates for checks. For example:
Here’s what I ended up with. This is the table I assembled in Power BI
Here’s how the final table looks. Among the advantages of this solution, I want to highlight that the table automatically interacts with the chart and has a color-coded cell system. Of course, similar things can be done using Excel, but here there is a more convenient interaction with the input data. Everything is simply organized in folders with the specified date, as I mentioned earlier. Here you have a ready table that turns the report in Navisworks into a convenient statistical representation of the progress of checks, with an intuitive interface. This approach makes the information accessible and interesting to understand.
As seen in the animation above, I can individually view each check and its statistics. This is convenient, as having a database allows you to easily create charts of your choice. The tools for creating charts are quite simple to use.
As a result, by spending some time on Power BI, I’ve developed a functional and effective tool for visualizing data and statistics related to model collisions. I plan to further explore and refine this tool to gain a deeper and more nuanced understanding of its capabilities.
Forecasting
I decided to enhance this article with some code, specifically a bit of specialized code. For example, many of you have encountered a situation where the Project Manager, looking at all the collision reports, asks a perfectly reasonable question:
“When, in your opinion, can we resolve all these errors?”
The question is indeed complex as it relies solely on previous experience and is heavily dependent on personal expertise and numerous unpredictable factors. However, statistics is a ruthless thing; it’s based on our experience. This means that having data allows us to attempt to make predictions based on it. I started by deeply exploring what types of forecasting exist based on available data. Here are the main methods I selected at the first stage:
Jumping ahead, I’ll start with method number 2, then try method 4, and also touch on method 3. I also compiled a simple diagram for myself, showing which methods I chose at each stage and their complexity in use.
Linear Regression
And then it’s just a small step further. Since all the table data is stored in JSON format, I simply use Python and the scikit-learn library. This library already includes an implementation of the Linear Regression function.
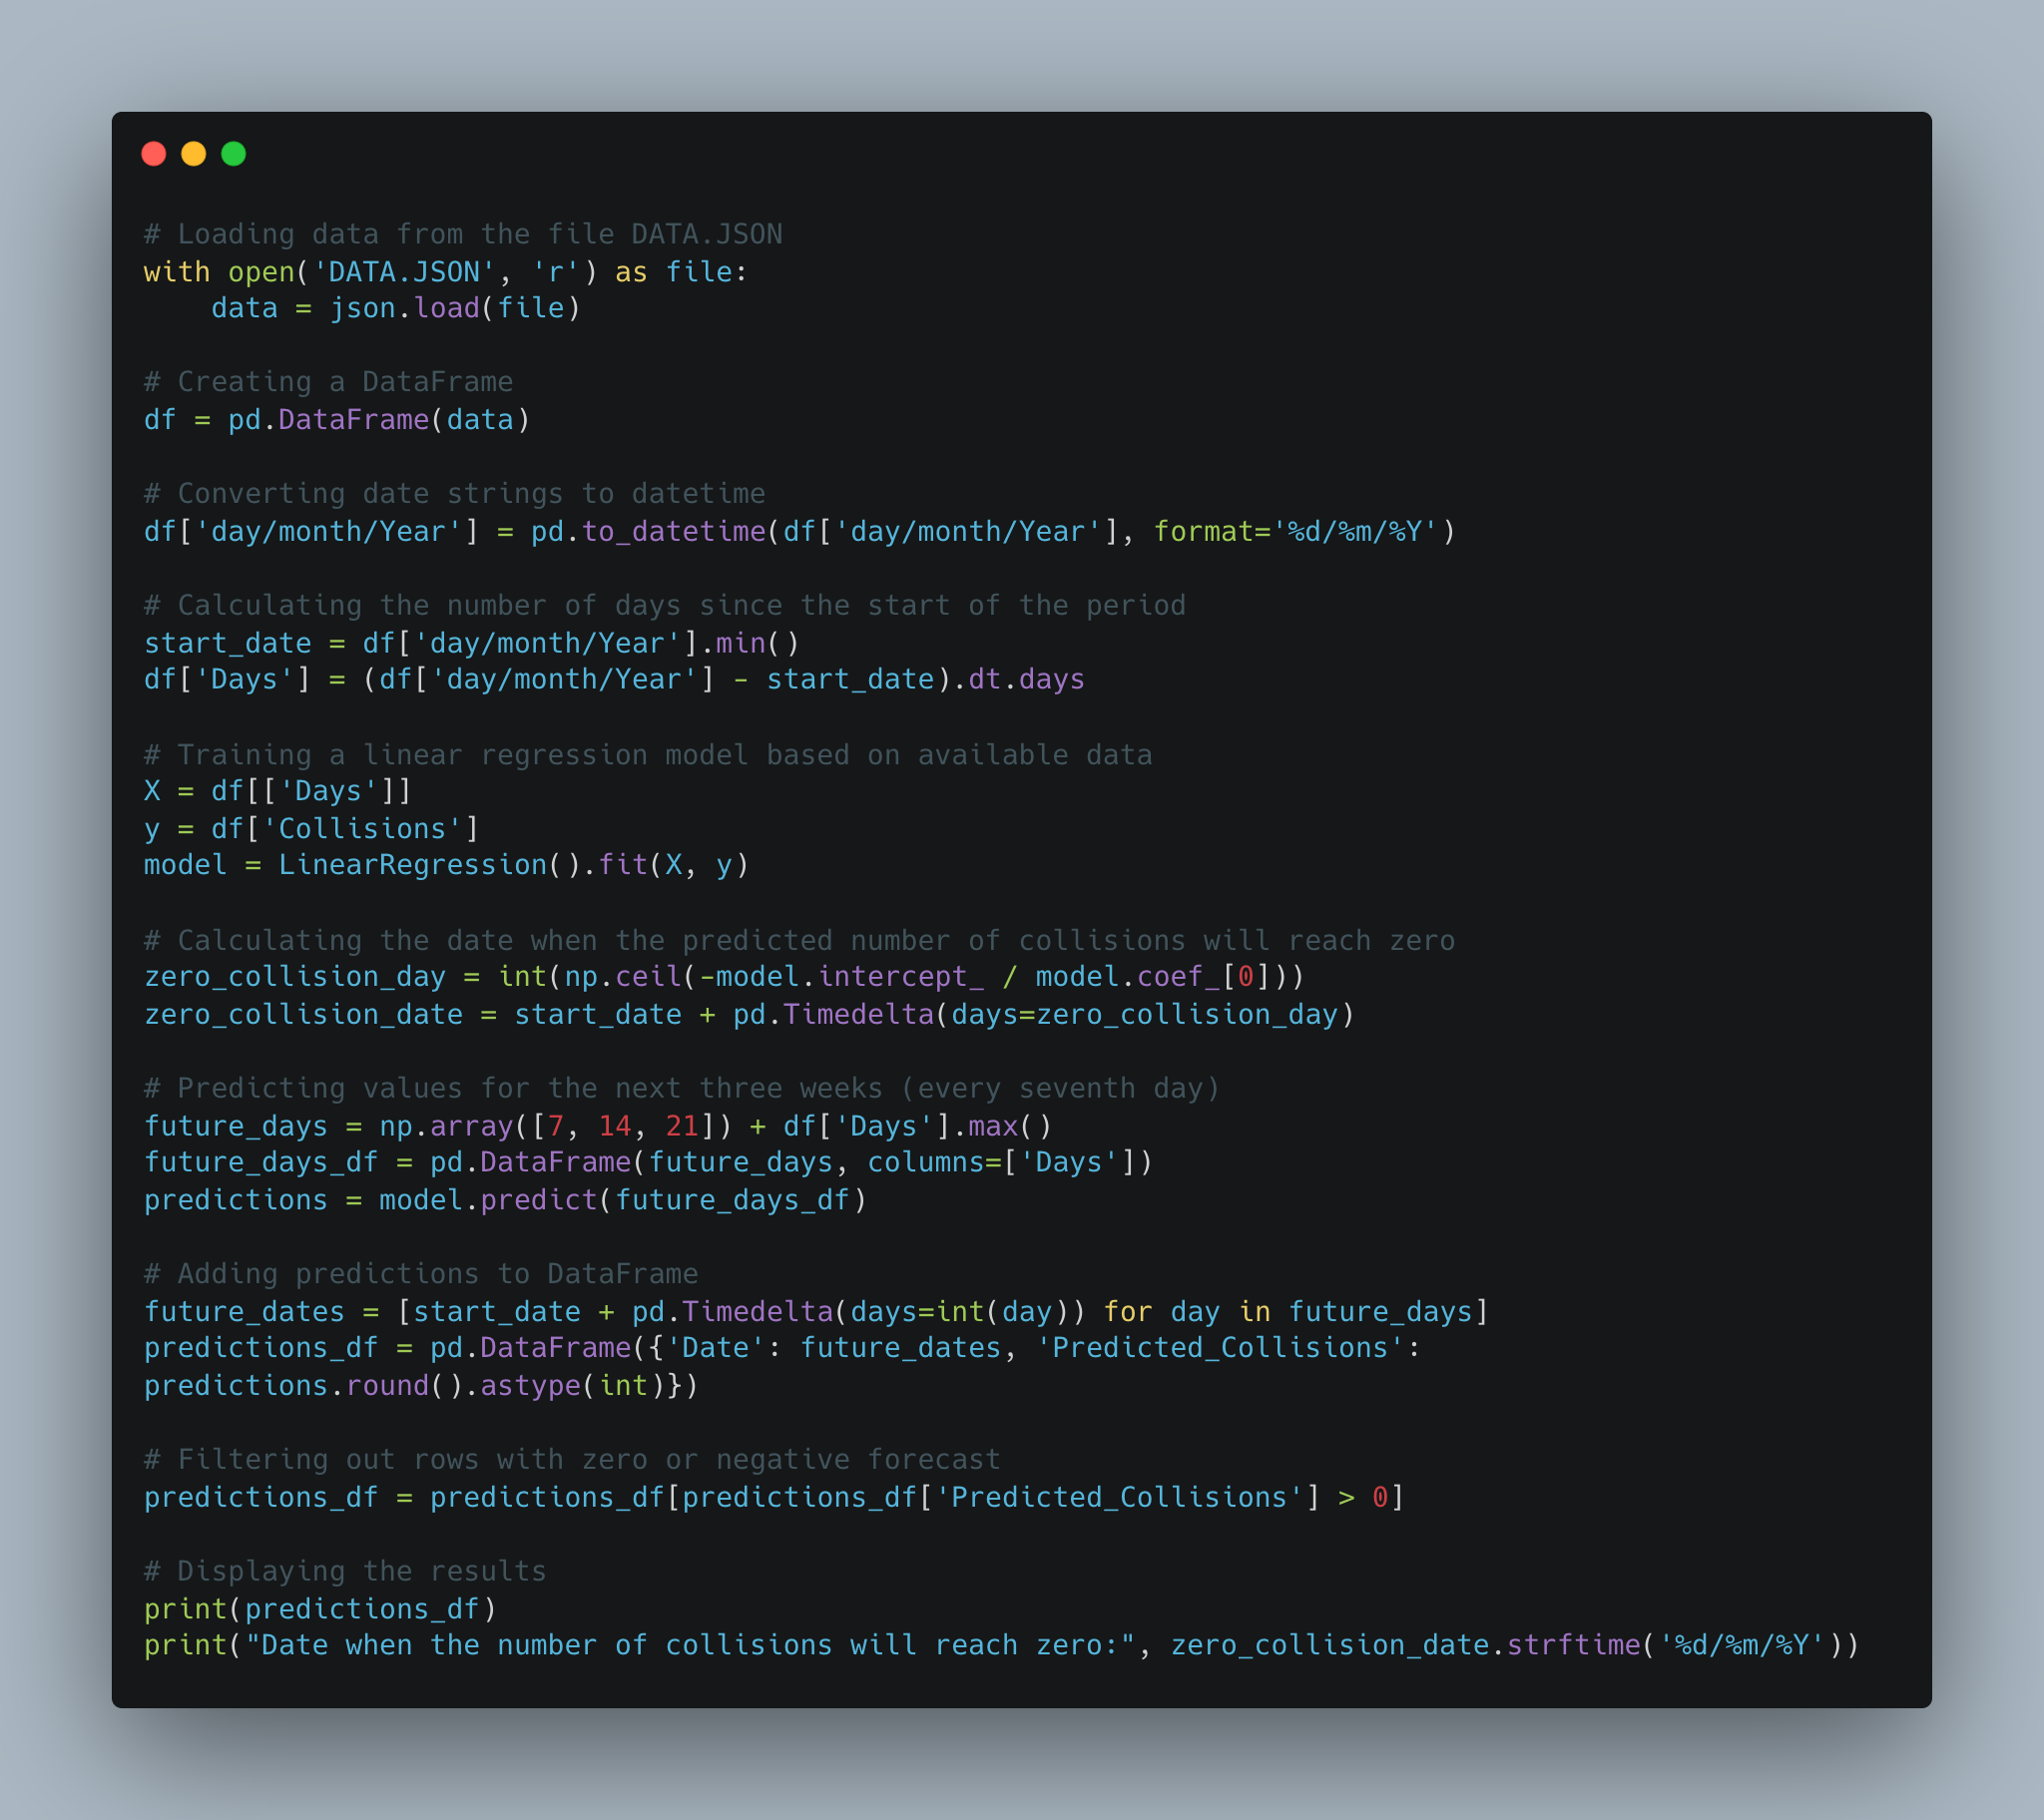
My last check was on December 19, 2023. According to the forecast using the Linear Regression method, the nearest collision resolution date is December 27, 2023. Very promising!
ARIMA Method (Autoregressive Integrated Moving Average)
However, during my experiments, I realized that the linear approach is not suitable for forecasting. So, I decided to try the ARIMA method:
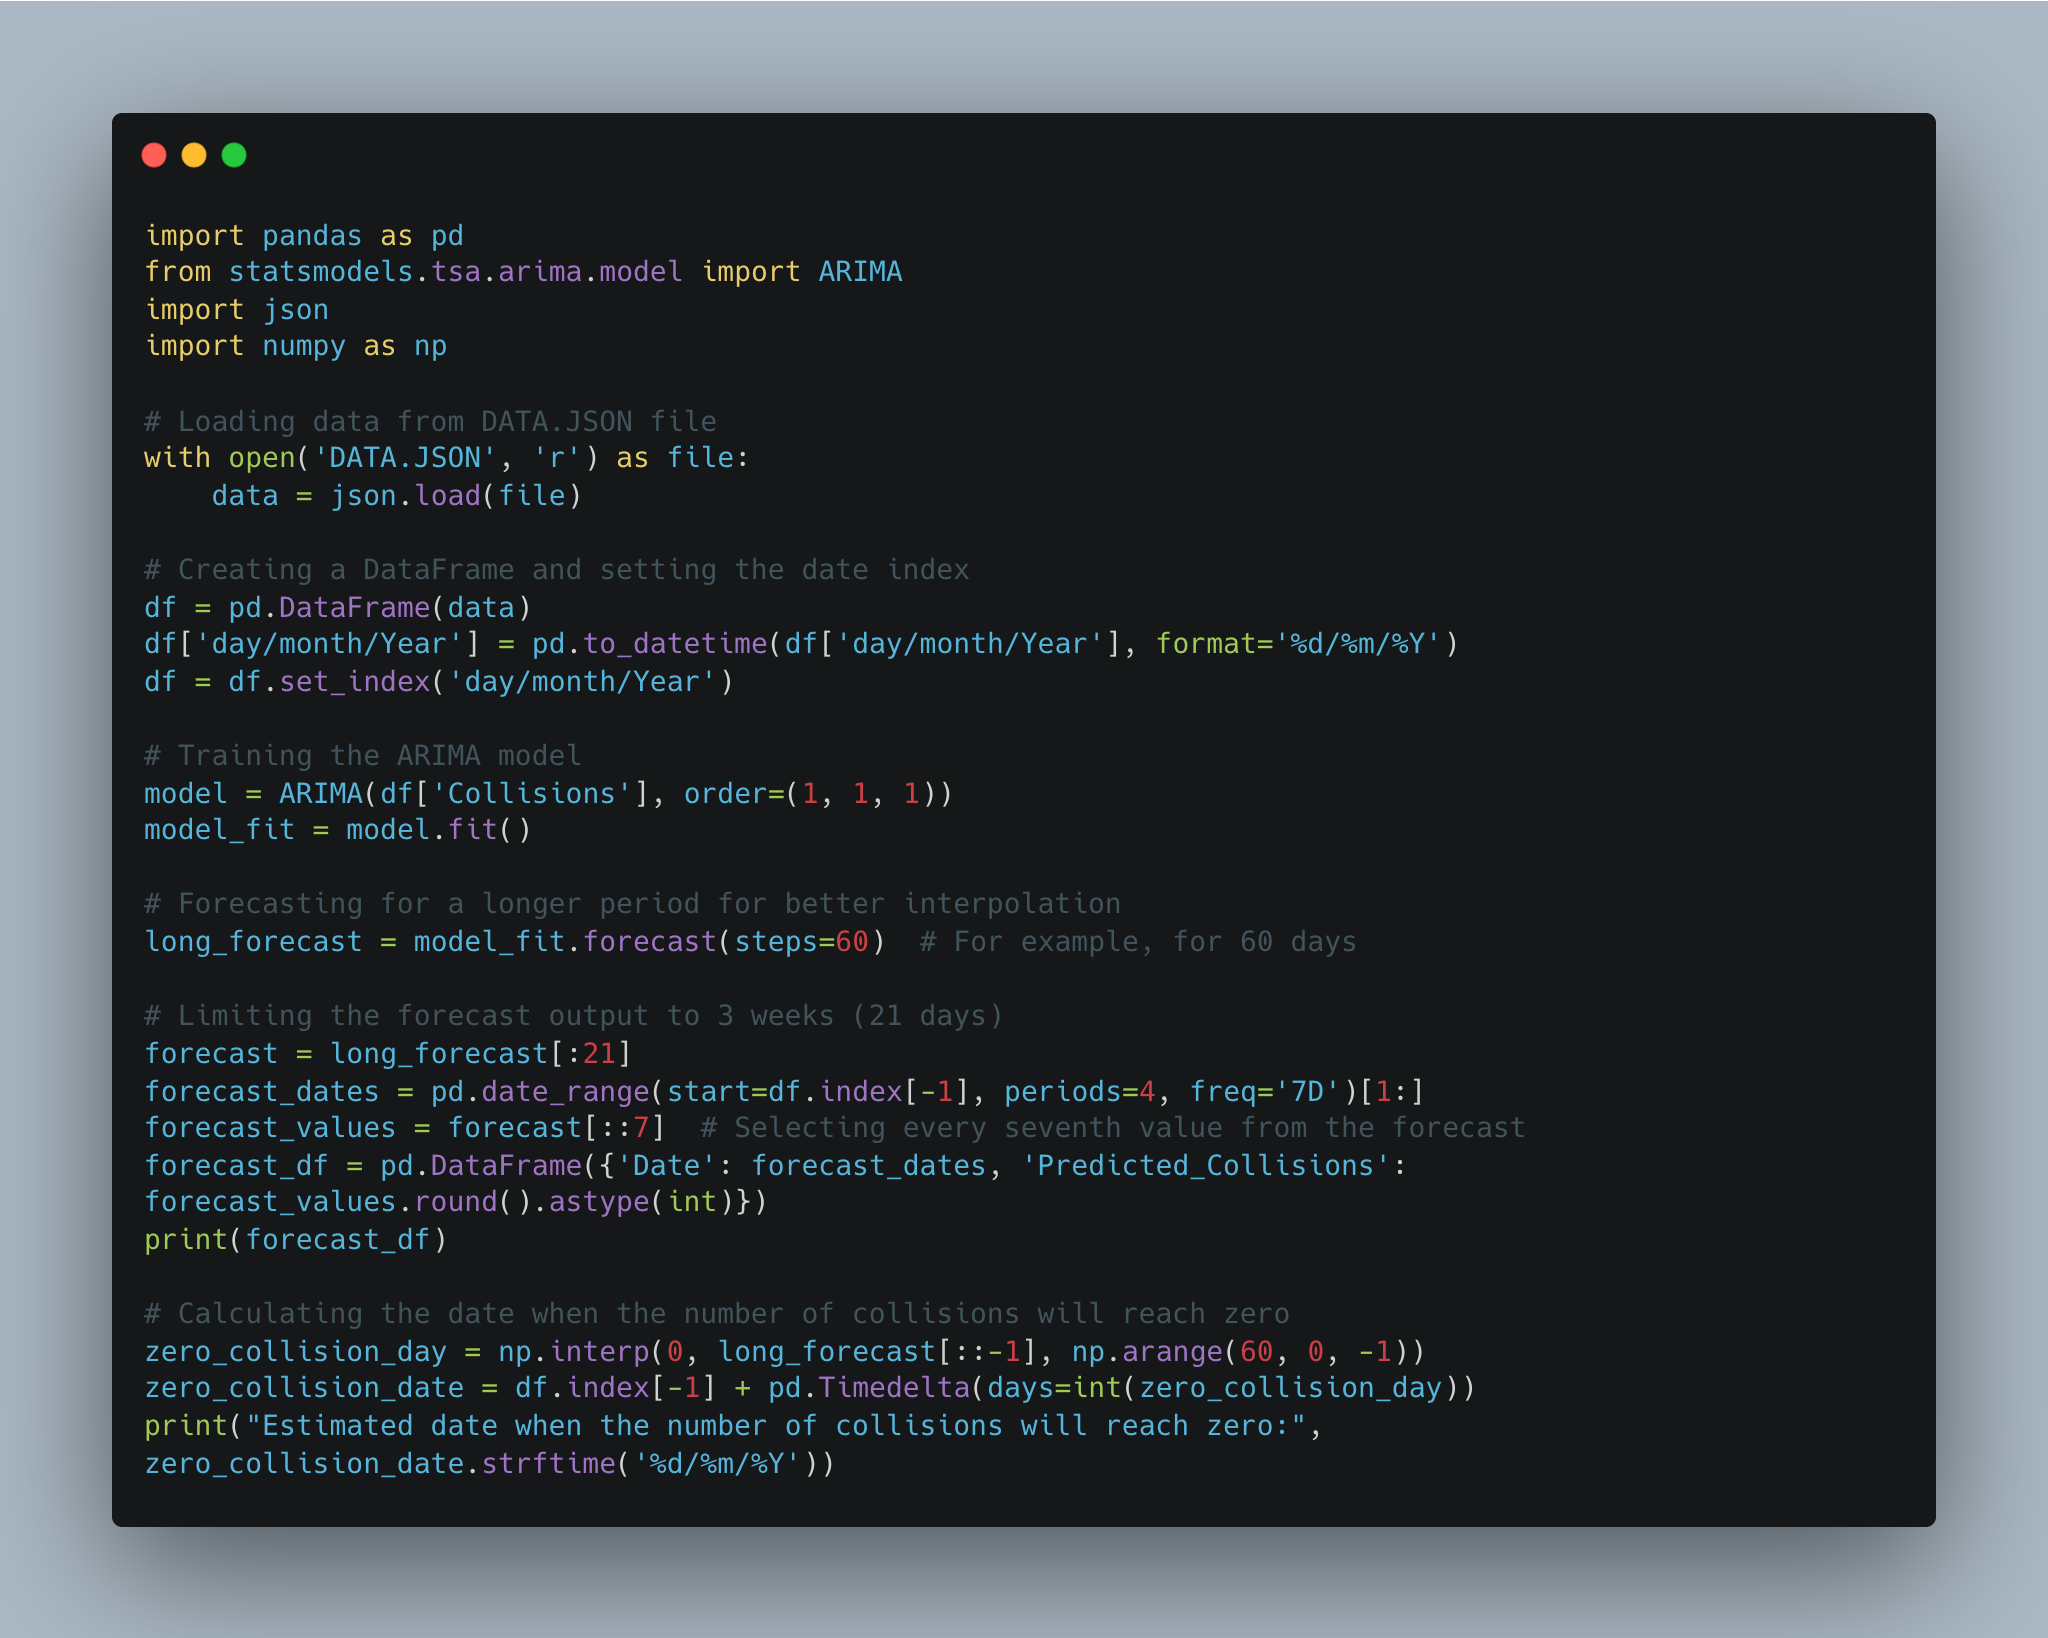
As a result, this method predicts February 17, 2024. The difference turns out to be almost 1.5 months. This raises the main question: Which date should I trust?And indeed, the answer lies in the method number 6 — “Qualification Methods”. This approach is based on the specialist’s experience. In this case, considering my own experience and taking into account the two dates obtained by different methods, the second date seems more realistic.
Below, I’ve compiled a table for you that reflects the main differences that led to such a disparity in the dates.
Conclusion
Despite the heavy workload at the end of the year, I found time to try Power BI — a tool I’ve been thinking about for a long time. Now, I have a raw but extremely useful tool for displaying the current status of the project. As a bonus, I can now approximately answer the eternal question: ‘When will the model be ready?’ Perhaps in the future, I’ll have the opportunity to delve into machine learning and train a model based on existing data to predict outcomes more accurately.
I hope you found this article interesting. I would love to hear your opinion or suggestions. It would be interesting to see or discuss methods of project management control.